Software

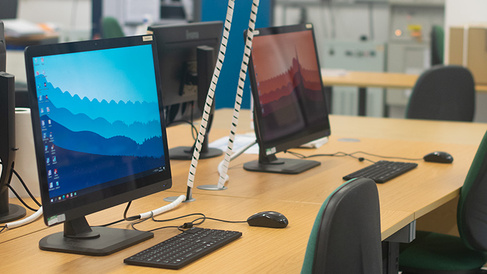
In addition to data collection computers, there are four computers dedicated for data analysis which can be used without booking. We have various software available for different tasks, detailed below:
Vendor-specific software:
Data collection
- Panalytical: Data Collector
- Bruker: Measurement Package - XRD Commander & Wizard
Viewing and converting data
- Panalytical: Data Viewer, Highscore+
- Bruker: EVA
Peak search and phase identification using ICDD PDF2
- Panalytical:HighScore+ Plots ICDD PDF2 reference data on experimental data
- Bruker: EVA, Search, can also plot ICDD 2018/2021 data in EVA (but not ICDD 2003)
Degree of crystallinity
- Panalytical: Profile fitting in HighScore+ followed by simple calculations in e.g. Excel
- Bruker: Profile fitting in Topas followed by simple calculations in e.g. Excel
Crystallite size and microstrain
- Panalytical: Profile fitting in HighScore+ peak widths followed by simple calculations in e.g. Excel
- Bruker: Topas with fundamental parameters, use Cheary and Cohen’s method to account for instrumental broadening - this is the most rigorous approach
Cell parameters for composition or strain on powder samples
- Panalytical: HighScore+ for profile fit then cell parameter refinement. HighScore+ for Reitveld (or Le Bail) profile fits & refines cell parameters in 1 go. For simple cubic systems, put cell parameters from several different ds into say Excel and extrapolate assuming a sample displacement error. For data on oriented thin films use Epitaxy.
- Bruker: Topas, routines for Le Bail and Rietveld refinement
Quantitative Phase Analysis
- Panalytical: Rietveld routine in HighScore+ (more rigorous), or Reference Intensity Ratio (RIR) in HighScore+ (‘semi-quantitative’), or use areas from profile fitting and callibration samples.
- Bruker: EVA with RIR method, or Topas with Rietveld
Calculating powder data from known structures
- Panalytical: Rietveld in HighScore+
- Bruker: Rietveld in Topas
Viewing, simulation and fitting of high resolution data
- Panalytical: Epitaxy or AMASS
- Bruker: Leptos (XRD)
Viewing, simulation and fitting of low angle reflectivity data
- Panalytical: Reflectivity or AMASS (Epitaxy is also helpful for viewing low angle reflectivity data)
- Bruker: Leptos (XRR)
SAXS data collection & preliminary data processing
- Bruker: SAXS and SAXS-Offline
Detailed SAXS data processing
- Bruker: DIFFRAC.SAXS
Viewing pole figures
- Panalytical: Dataviewer & Texture
- Bruker: TexEval
Vendor-neutral 3rd party software:
Viewing Structures
- CrystalMaker
Calculating, plotting & viewing stereographic projections
- Winwulff
Interfacing with AMASS, or other programming and maths
- MatLab, or Python using Jupyter Notebook, Spyder or Notepad++
See the available databases for phase identification and structural information
